Visualizing Cash Flow with Sankey Diagrams
Explore the value of Sankey Cash Flow Diagrams in personal finance to get a clear visual understanding of income allocation, aiding effective budgeting and financial planning.

Sankey Cash Flow Diagrams are helpful tools in managing personal finances, offering a visual way to see how income gets distributed across various expenses, savings, and investments. Known for their proportional flow lines or arrows, these diagrams make understanding one’s financial distribution and health straightforward.
Characteristics of Sankey Cash Flow Diagrams
- Proportional Flows: The widths of lines or arrows match the amount of cash flow, illustrating where your money goes.
- Directional Clarity: Clearly depict the flow of money, from income sources to expenditures and savings.
- Budget Visualization with Color Coding: Ideal for showing how a household budget is allocated, using different colors to distinguish expense types and income sources.
- Insights into Financial Health: Point out potential areas of overspending or opportunities for increased savings.
Leveraging Sankey Diagrams in Personal Finance
Sankey Cash Flow Diagrams are particularly useful for:
- Household Budgeting: Lay out how a family’s income is divided among expenses, savings, and debt repayments.
- Personal Financial Planning: Aid in planning and tracking personal income and expenditures.
- Gaining Insights into Financial Habits: Help in identifying spending trends and areas for improvement.
- Scenario Analysis: Useful for visualizing potential changes in income or expenses and their effects on finances.
Visualizing How Your Money Flows
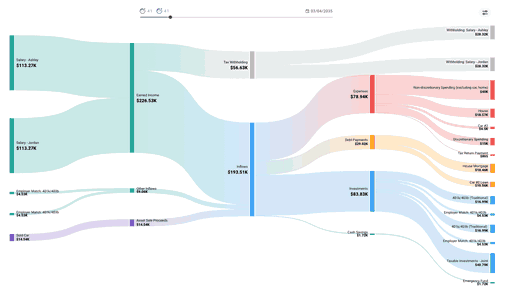
A Sankey Cash Flow Diagram can show you exactly how your funds are allocated. For instance, it can display the proportion of income going toward essentials like rent and groceries, savings, and discretionary spending like entertainment. This clear visual representation can be a significant aid in better planning and budgeting.
Create Cash Flow Diagrams in ProjectionLab
ProjectionLab enables you to create Sankey Cash Flow Diagrams for financial planning. They serve as a visual aid in understanding cash flows, highlighting opportunities for financial improvement. Start exploring your financial future and see how your cash flows over time with ProjectionLab.